Turn Executions
If your AI pipeline relies on text-based inputs—such as a Web Text Chatbot widget, a standard Mail integration, or WhatsApp—it processes user inputs as self-contained "Turns".
The Turn Executions dashboard is not just a chat history log; it is an extreme-density forensic tool. It is designed specifically for Prompt Engineers and System Administrators who need to audit exactly how an LLM arrived at a specific conclusion.
1. Why do Turn Executions exist?
When an end-user complains: "The customer support bot gave me a completely wrong price," standard chat logs are useless. You need to know if the AI hallucinated, or if it pulled the wrong price from the Vector Database, or if the System Prompt failed to inject the correct context.
Turn Executions solve this by providing:
- Node-by-Node Tracing: Visualizing exactly which tools (Vector Stores, APIs, Calculators) triggered before the LLM responded.
- Raw Payload Inspection: Allowing you to read the exact JSON that was shipped to OpenAI, Anthropic, or local models.
- Financial Auditing: Tracking exact token usage on a per-message basis, rather than just monthly aggregates.
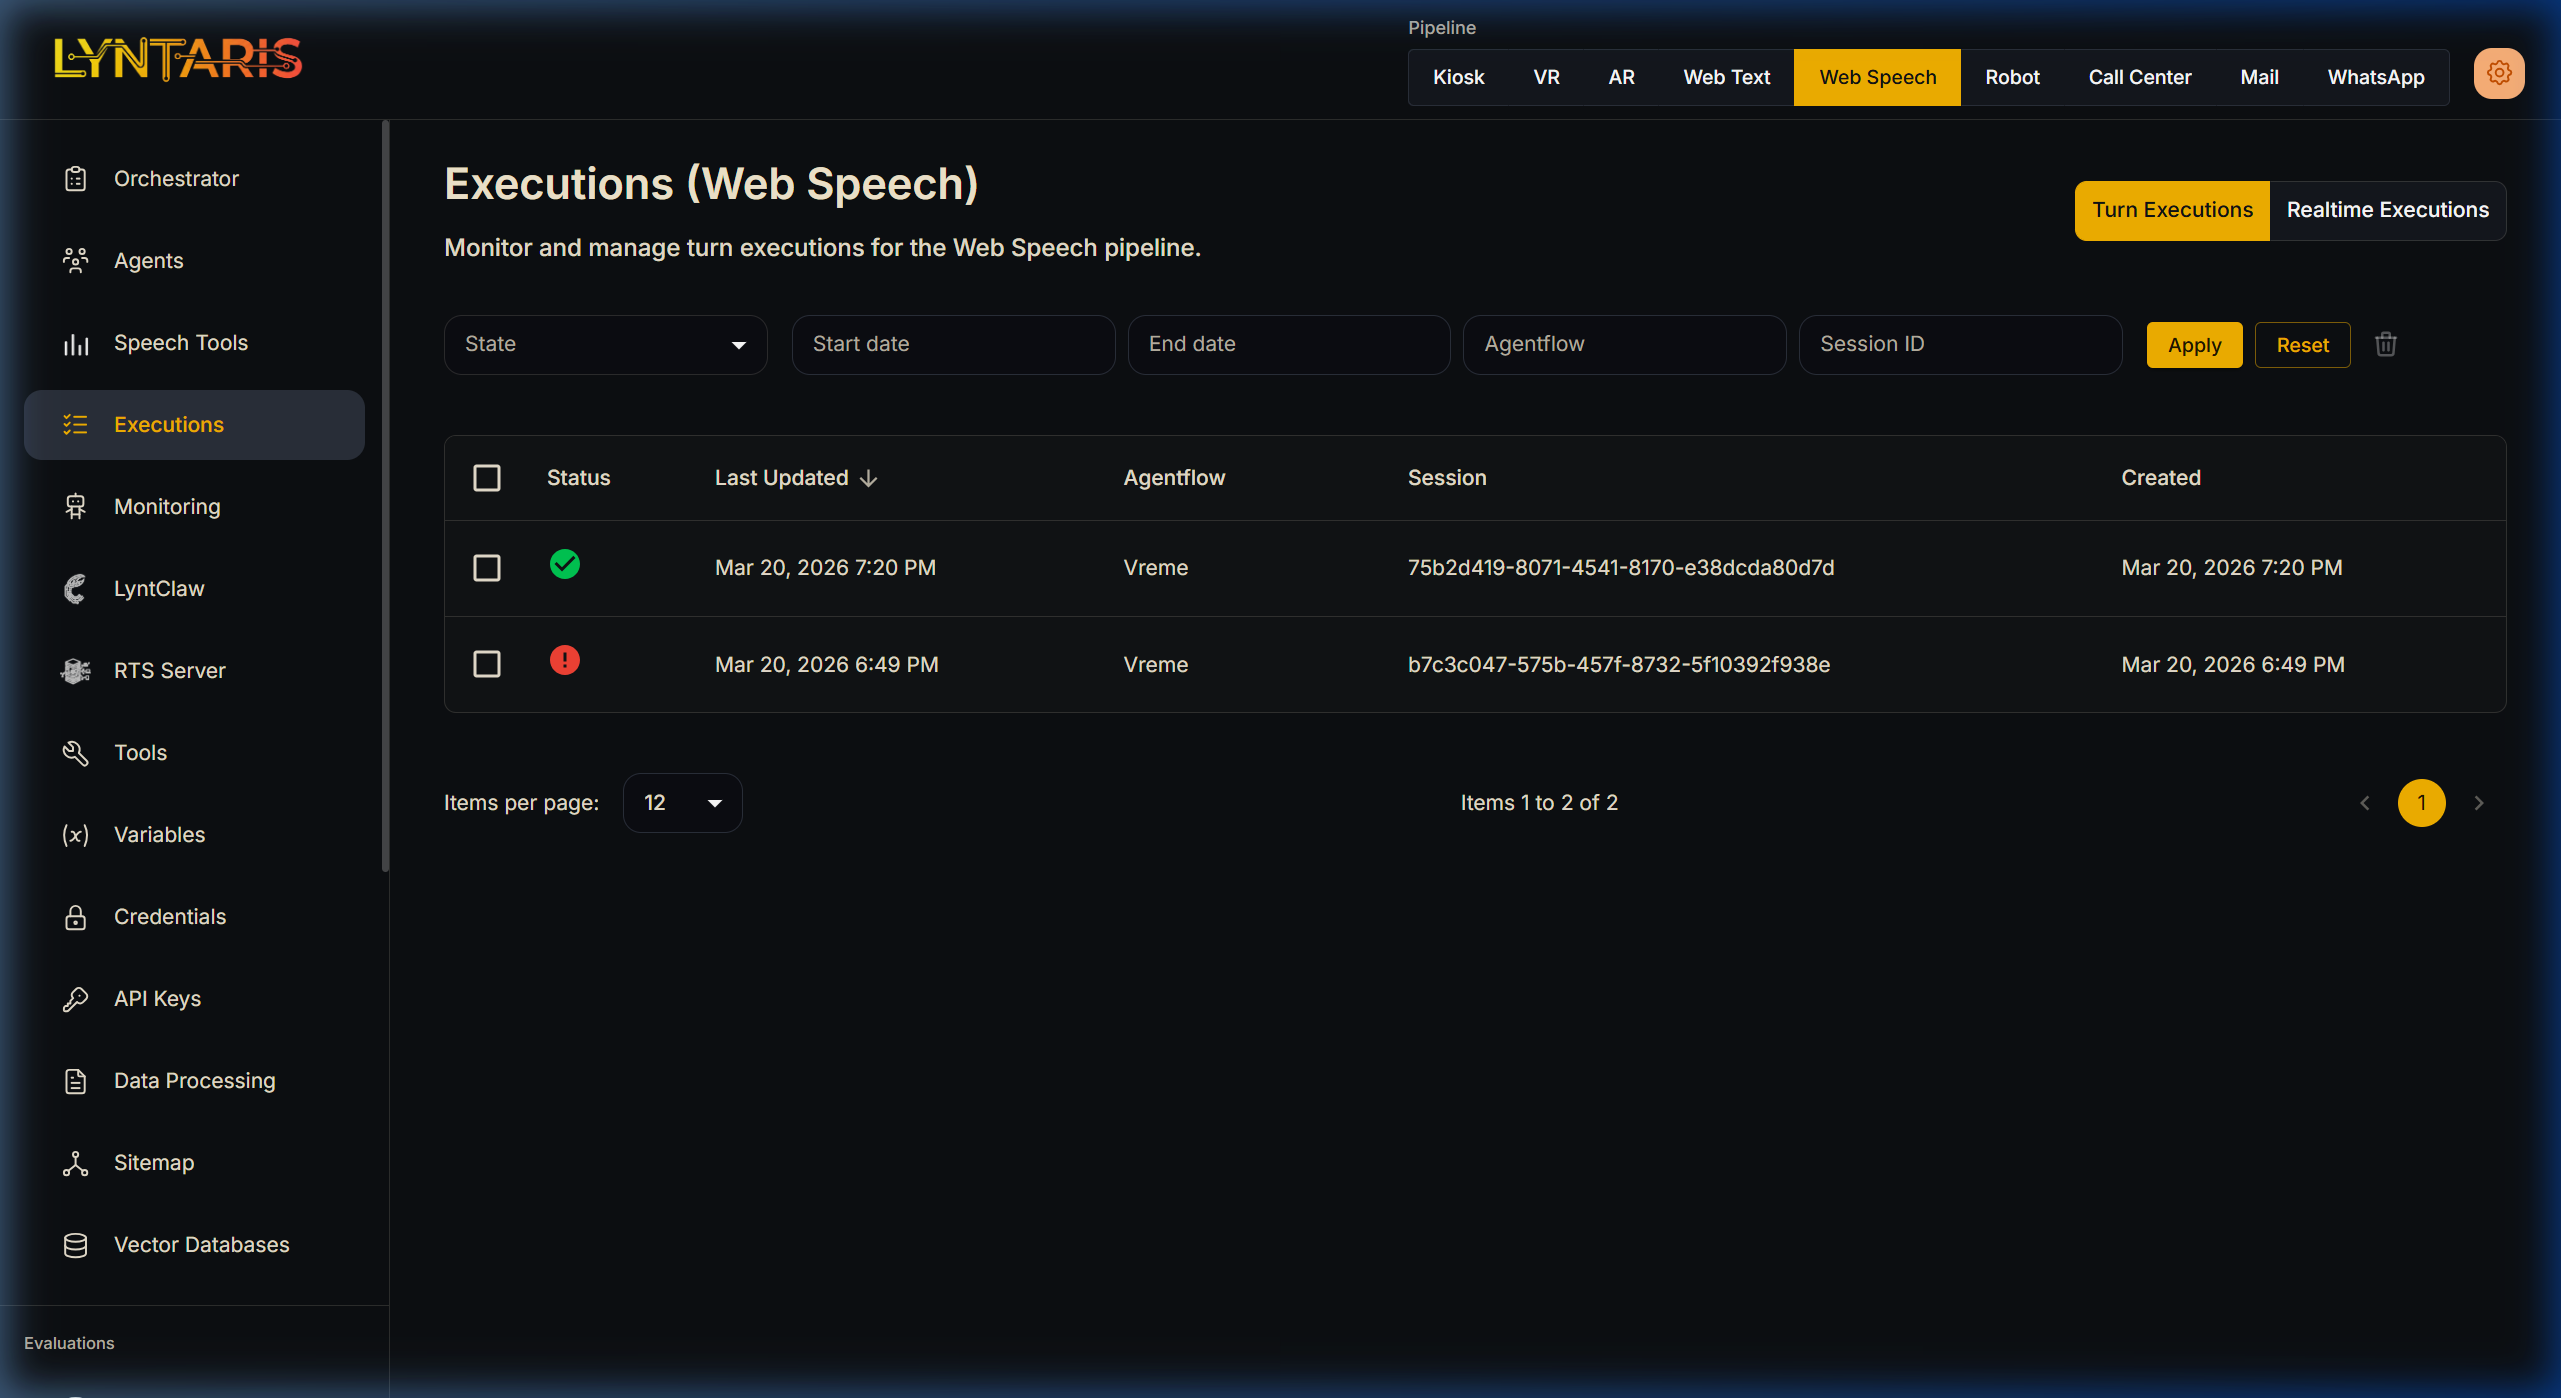
Filtering text-based executions for the 'Vreme' (Weather) Agentflow
As shown above, the list view allows you to filter through thousands of interactions across pipelines to find executions with ERROR states, or to drill down into a specific Session ID to watch a conversation evolve.
2. Practical Debugging: The Forensic View
Clicking on any specific execution row opens the deep trace. Below is an example of an AI agent programmed to function as a weather assistant (Vreme).
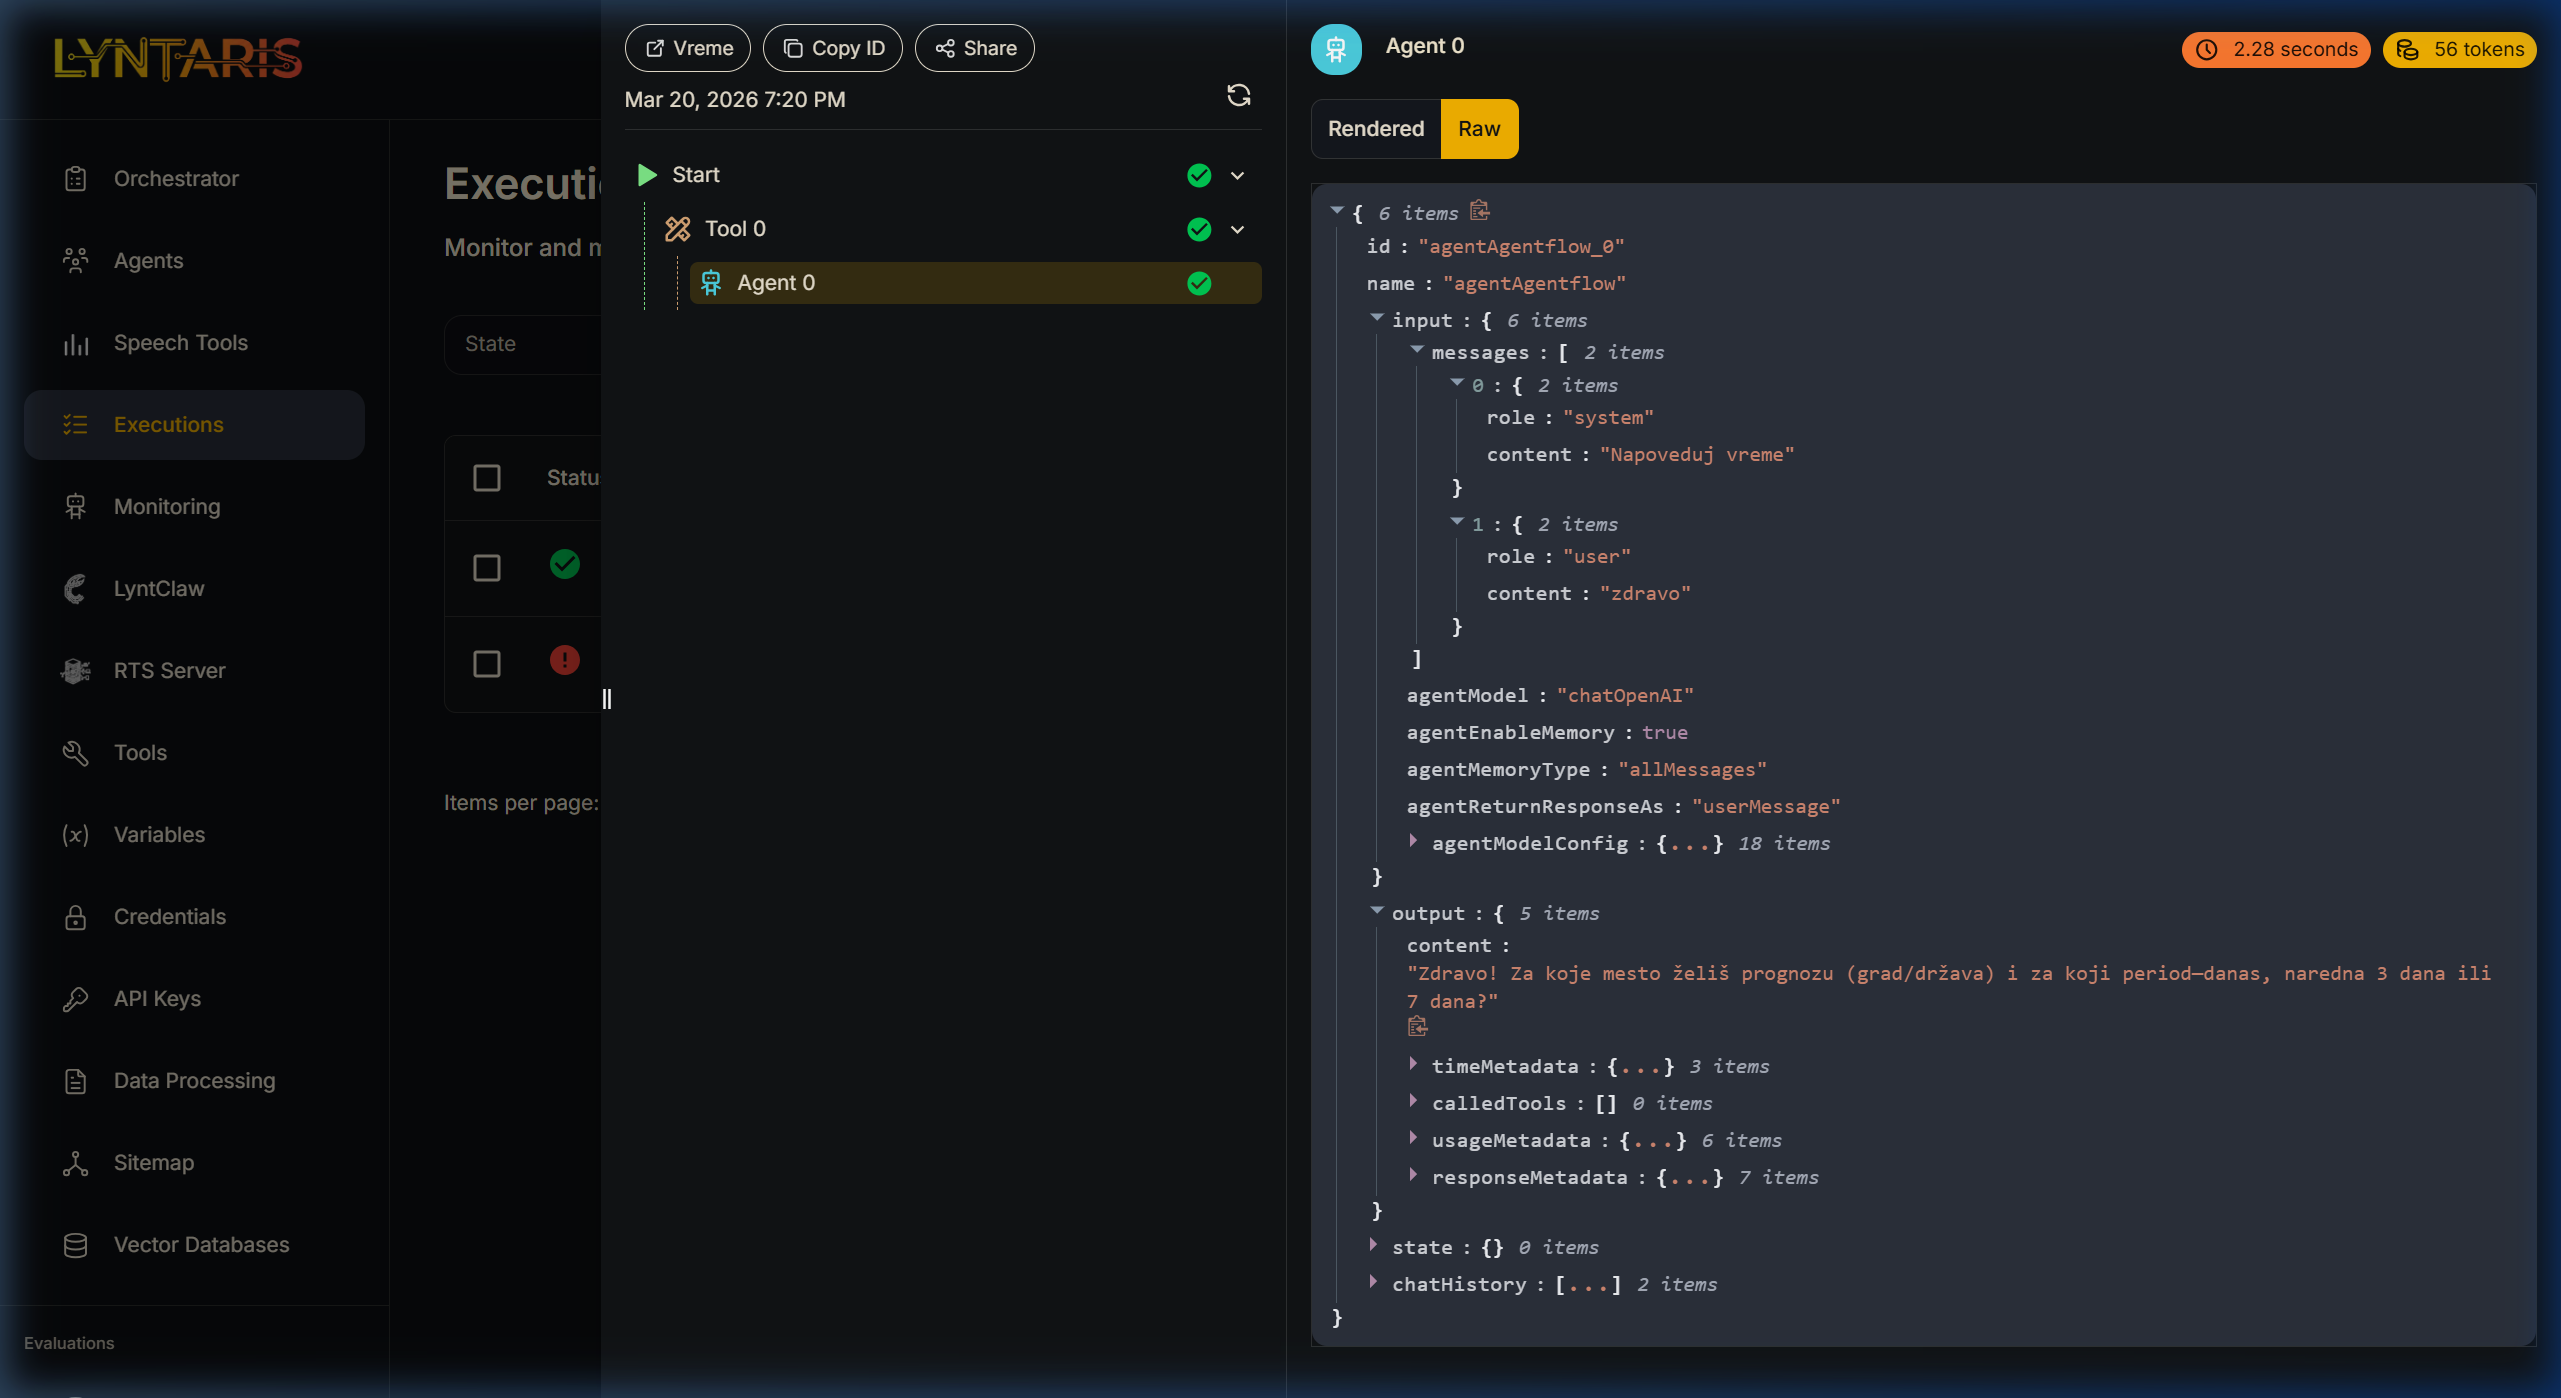
Expanding the Raw JSON trace of an Agentflow
Understanding the Trace Panel (Left)
Notice the execution sequence in the middle column:
Start->Tool 0->Agent 0This proves that before the LLM (Agent 0) spoke to the user, a prerequisite tool (Tool 0) was successfully executed. If a tool fails (e.g., an API timeout), a red exclamation mark will highlight exactly where the chain collapsed.
Understanding the Raw JSON (Right)
Switching the payload viewer to Raw mode reveals the ultimate source of truth.
- Auditing the System Prompt: Under
messages[0], you can see the role issystemand the content was parsed as"Napoveduj vreme"(Predict weather). If the AI behaved out of character, you check here first to see if your system variable injections worked. - Performance Metrics: Notice the tags in the top right corner of the Agent pane:
2.28 secondsand56 tokens. If an overarching agent flow is suddenly costing $50/day, you can use these traces to discover that one specific Prompt Node is consuming 4,000 tokens per turn due to a massive, un-chunked document injection. - Output Payload: Expand the
outputarray to see not just the text response ("Zdravo! Za koje mesto želiš prognozu..."), but also the associatedusageMetadatatracking exact completion tokens billed by the external LLM provider.
3. Export and automation (REST)
If you need to list, fetch, or delete execution records from your own systems (SIEM, compliance tooling), use the executions HTTP API on your Lyntaris host. The full technical reference (paths, authentication, examples) is maintained in the Lyntaris technical documentation package for your deployment—not duplicated here.