Monitoring & Executions
Standard conversational AI platforms typically offer basic telemetry and token counting. Lyntaris, however, is designed as an Omni-Channel Architecture.
Because your LLMs might be simultaneously running inside interactive VR applications, physical Kiosks, and Website Chatbots, the Lyntaris Monitoring page acts as a centralized Fleet Management & Business Intelligence command center.
Analytics console
The Analytics item in the sidebar opens the analytics console (embedded app under /analytics). It is separate from Monitoring (/monitoring): use Analytics for the packaged reporting/tracing experience your build ships with, and Monitoring for live fleet status, pipeline-scoped cost, and operator actions described below. If a chart or filter is unclear, check with your administrator—some views depend on optional telemetry services.
1. Fleet Management & Global Usage
Lyntaris connects to edge runtimes (kiosks, call-center hosts, VR clients, and similar) that register with the platform. The top section of the Monitoring dashboard lists those connections alongside your global usage and cost picture.
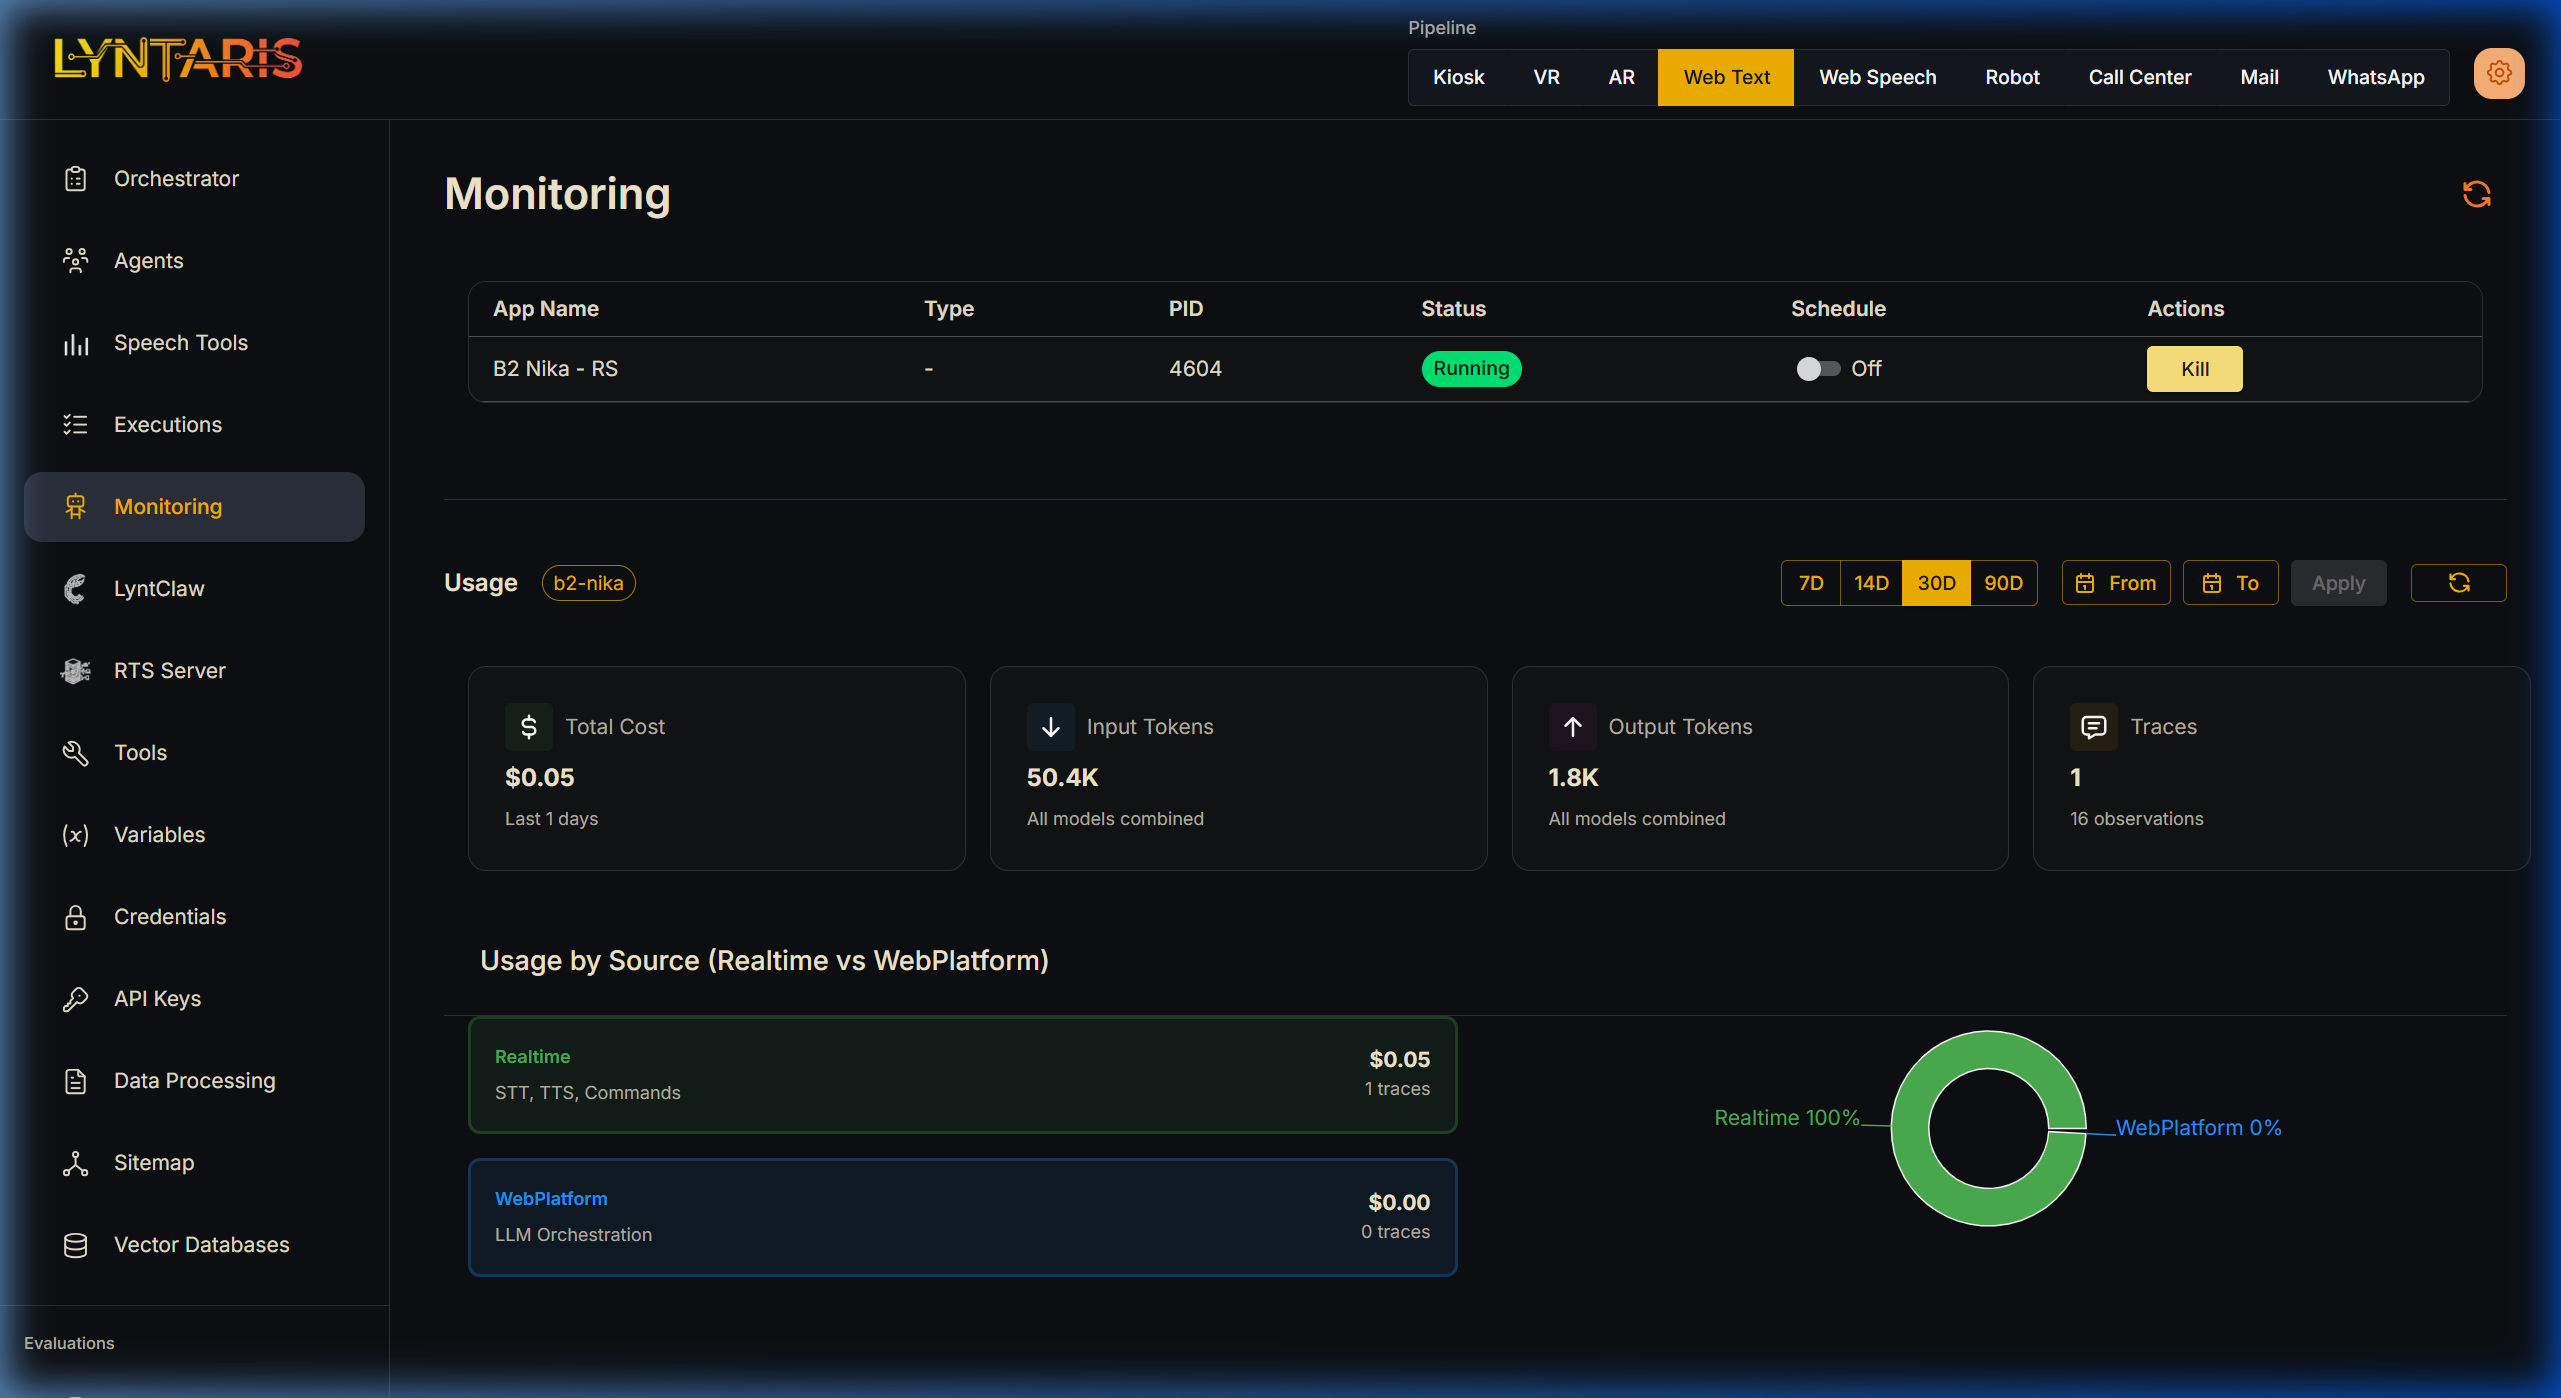
Live Server Control
- Active Connections: See all actively pinging Unity application servers (e.g., B2 Nika - RS, physical Kiosk PCs, VR headsets).
- PID Tracking: Ensures you know exactly which OS Process ID is handling your deployment on edge devices.
- Remote Kill/Start: You can remotely terminate or restart specific AI processes locally or across the network directly from the browser under the Actions column.
Realtime vs WebPlatform Attribution
If an interactive Kiosk is running, Lyntaris explicitly separates Realtime streams from classical WebPlatform operations. Here you can visually separate the cost of the Voice AI loops (STT conversions, Text-to-Speech audio generation) from standard text-based conversational flows.
2. Multi-Pipeline Financials
Understanding the Return on Investment (ROI) of AI requires knowing exactly where money is being spent. Are your website chatbots eating your budget, or is the new VR deployment highly demanding?
Lyntaris introduces a Pipeline Selector located in the top navigation bar.
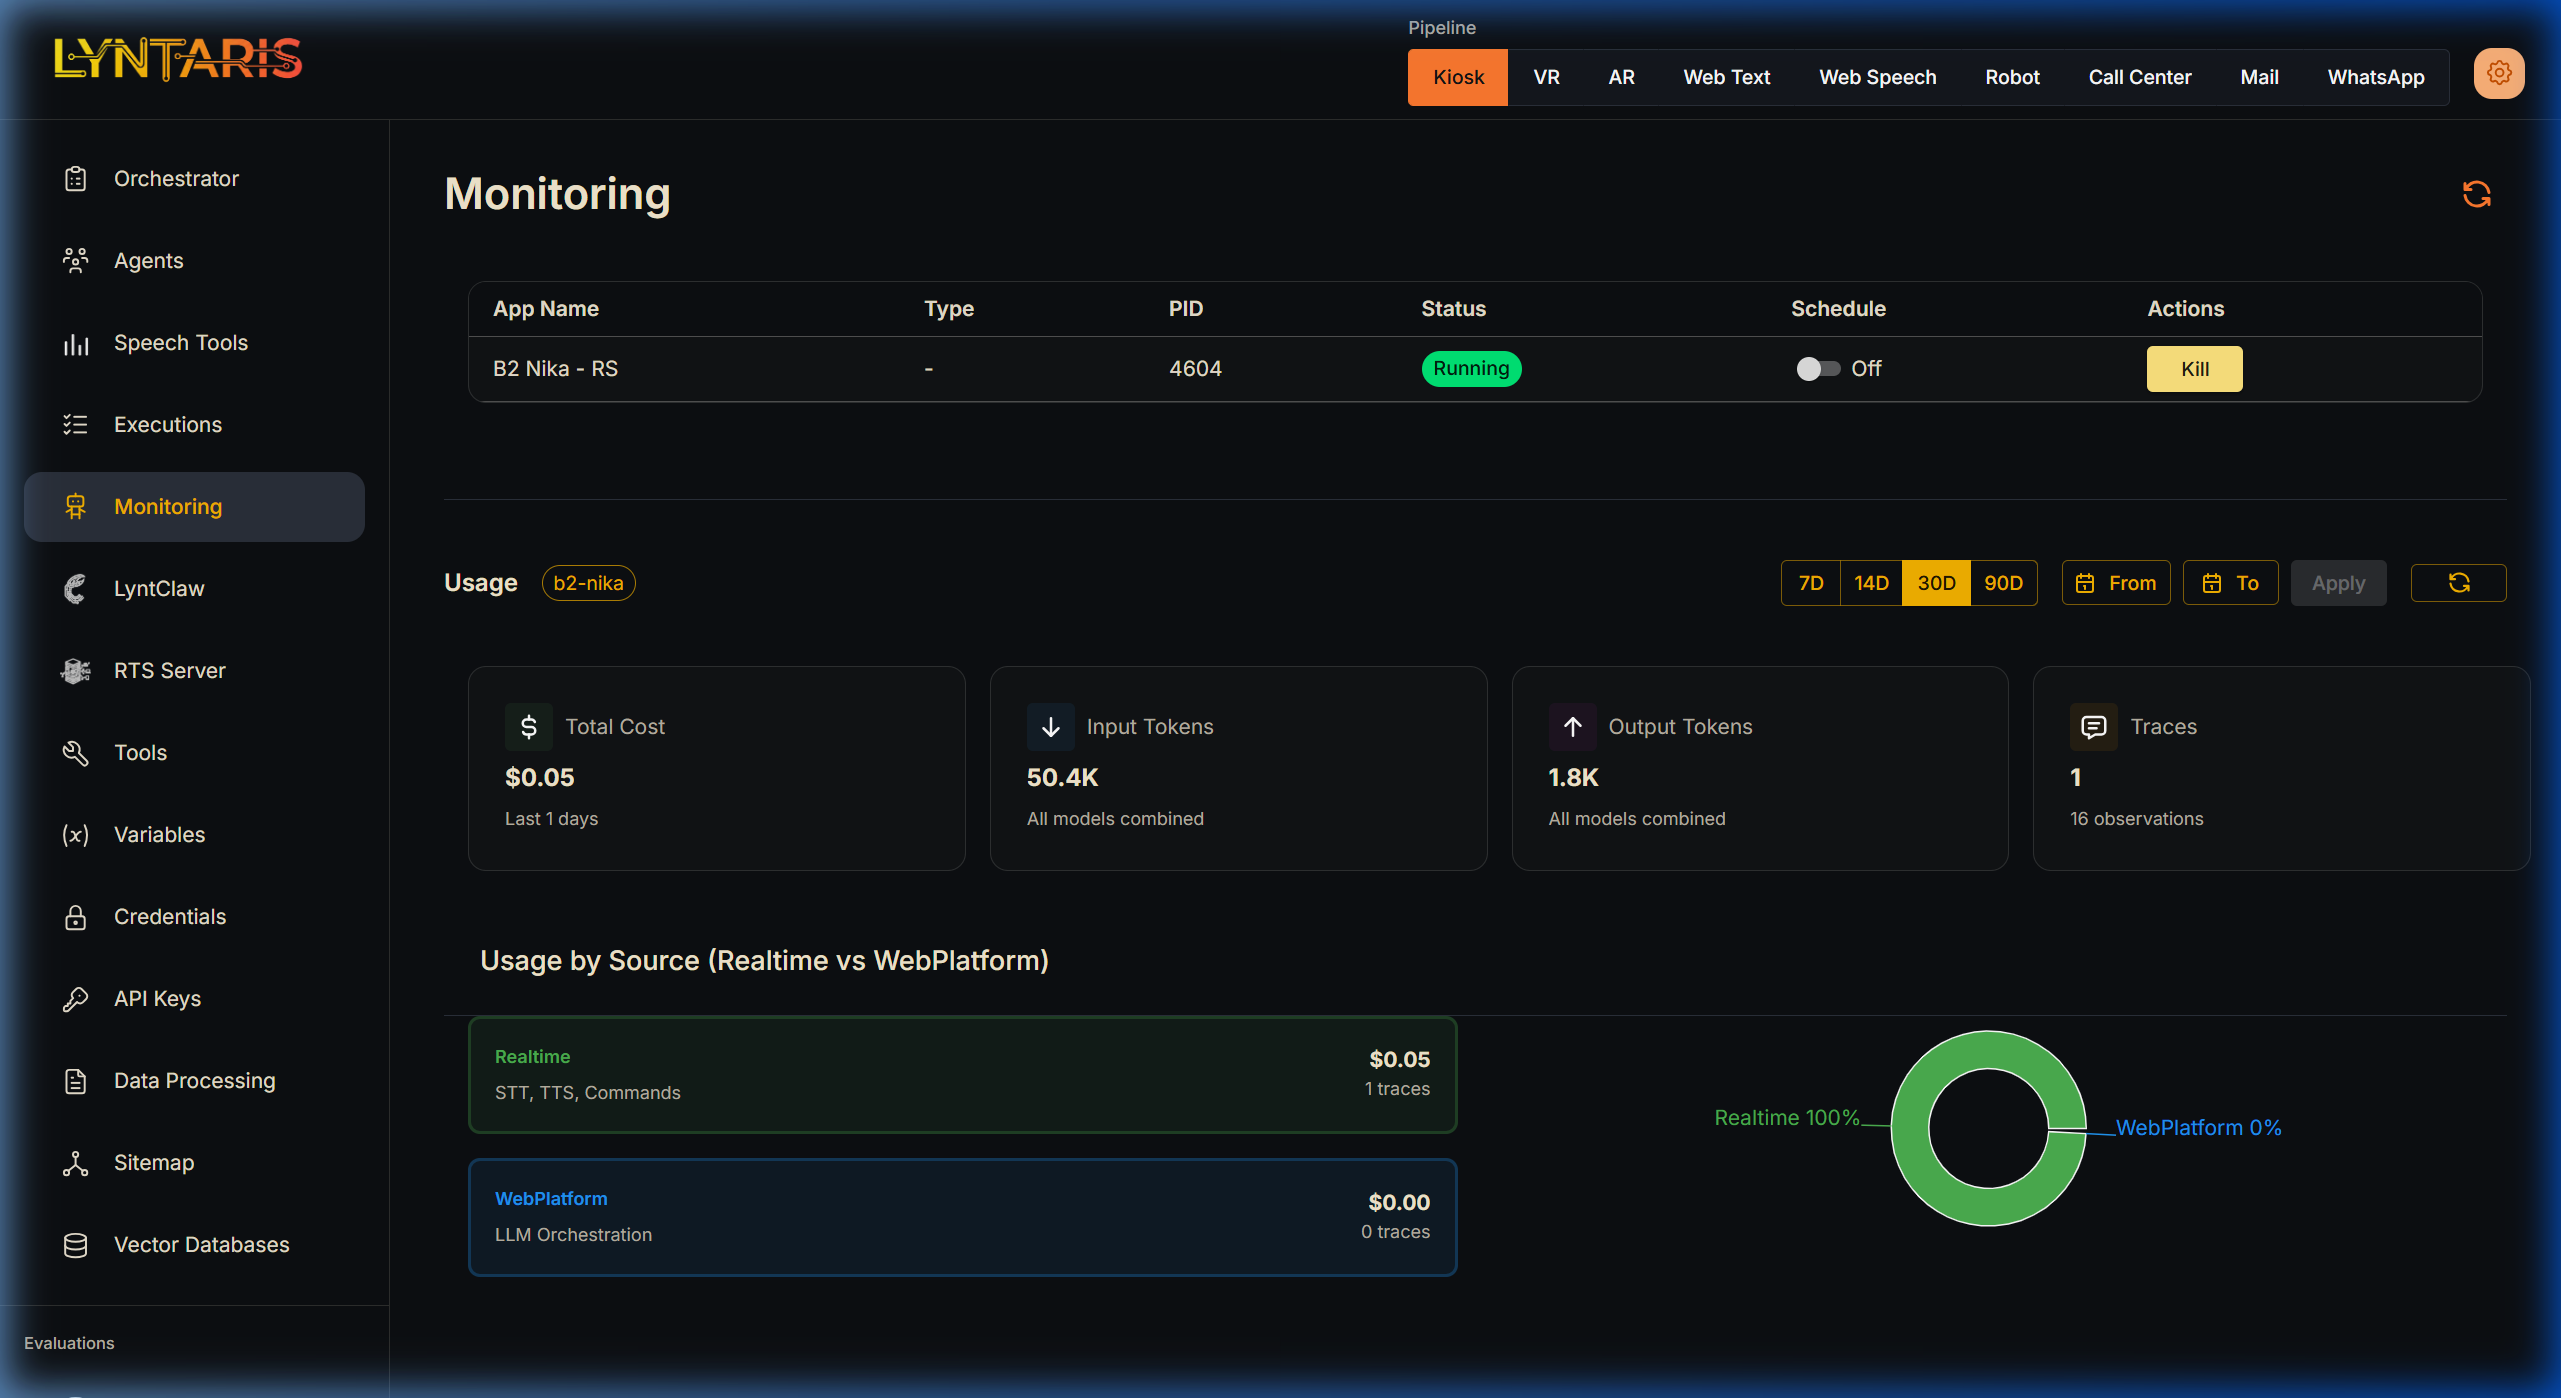
When you select Kiosk, VR, Web Text, or WhatsApp, the entire Usage Dashboard re-calculates to show metrics isolating that specific hardware/software channel:
- Total Cost: A real-time calculation of your expenditure in USD across all connected LLMs (e.g., OpenAI, Anthropic, Azure) for this specific channel.
- Input / Output Tokens: Evaluate if a specific pipeline (like Voice) is consuming more tokens than another (like Web Chat) due to verbose background prompting requirements.
- Traces: The absolute count of conversational "turns" or background orchestration steps the AI has performed.
3. Deep-Dive Cost Analytics
Scrolling down reveals the Daily Trend graph and Detailed Category Breakdown charts. Because Lyntaris pipelines are deeply multi-modal, simple token counting is not enough.
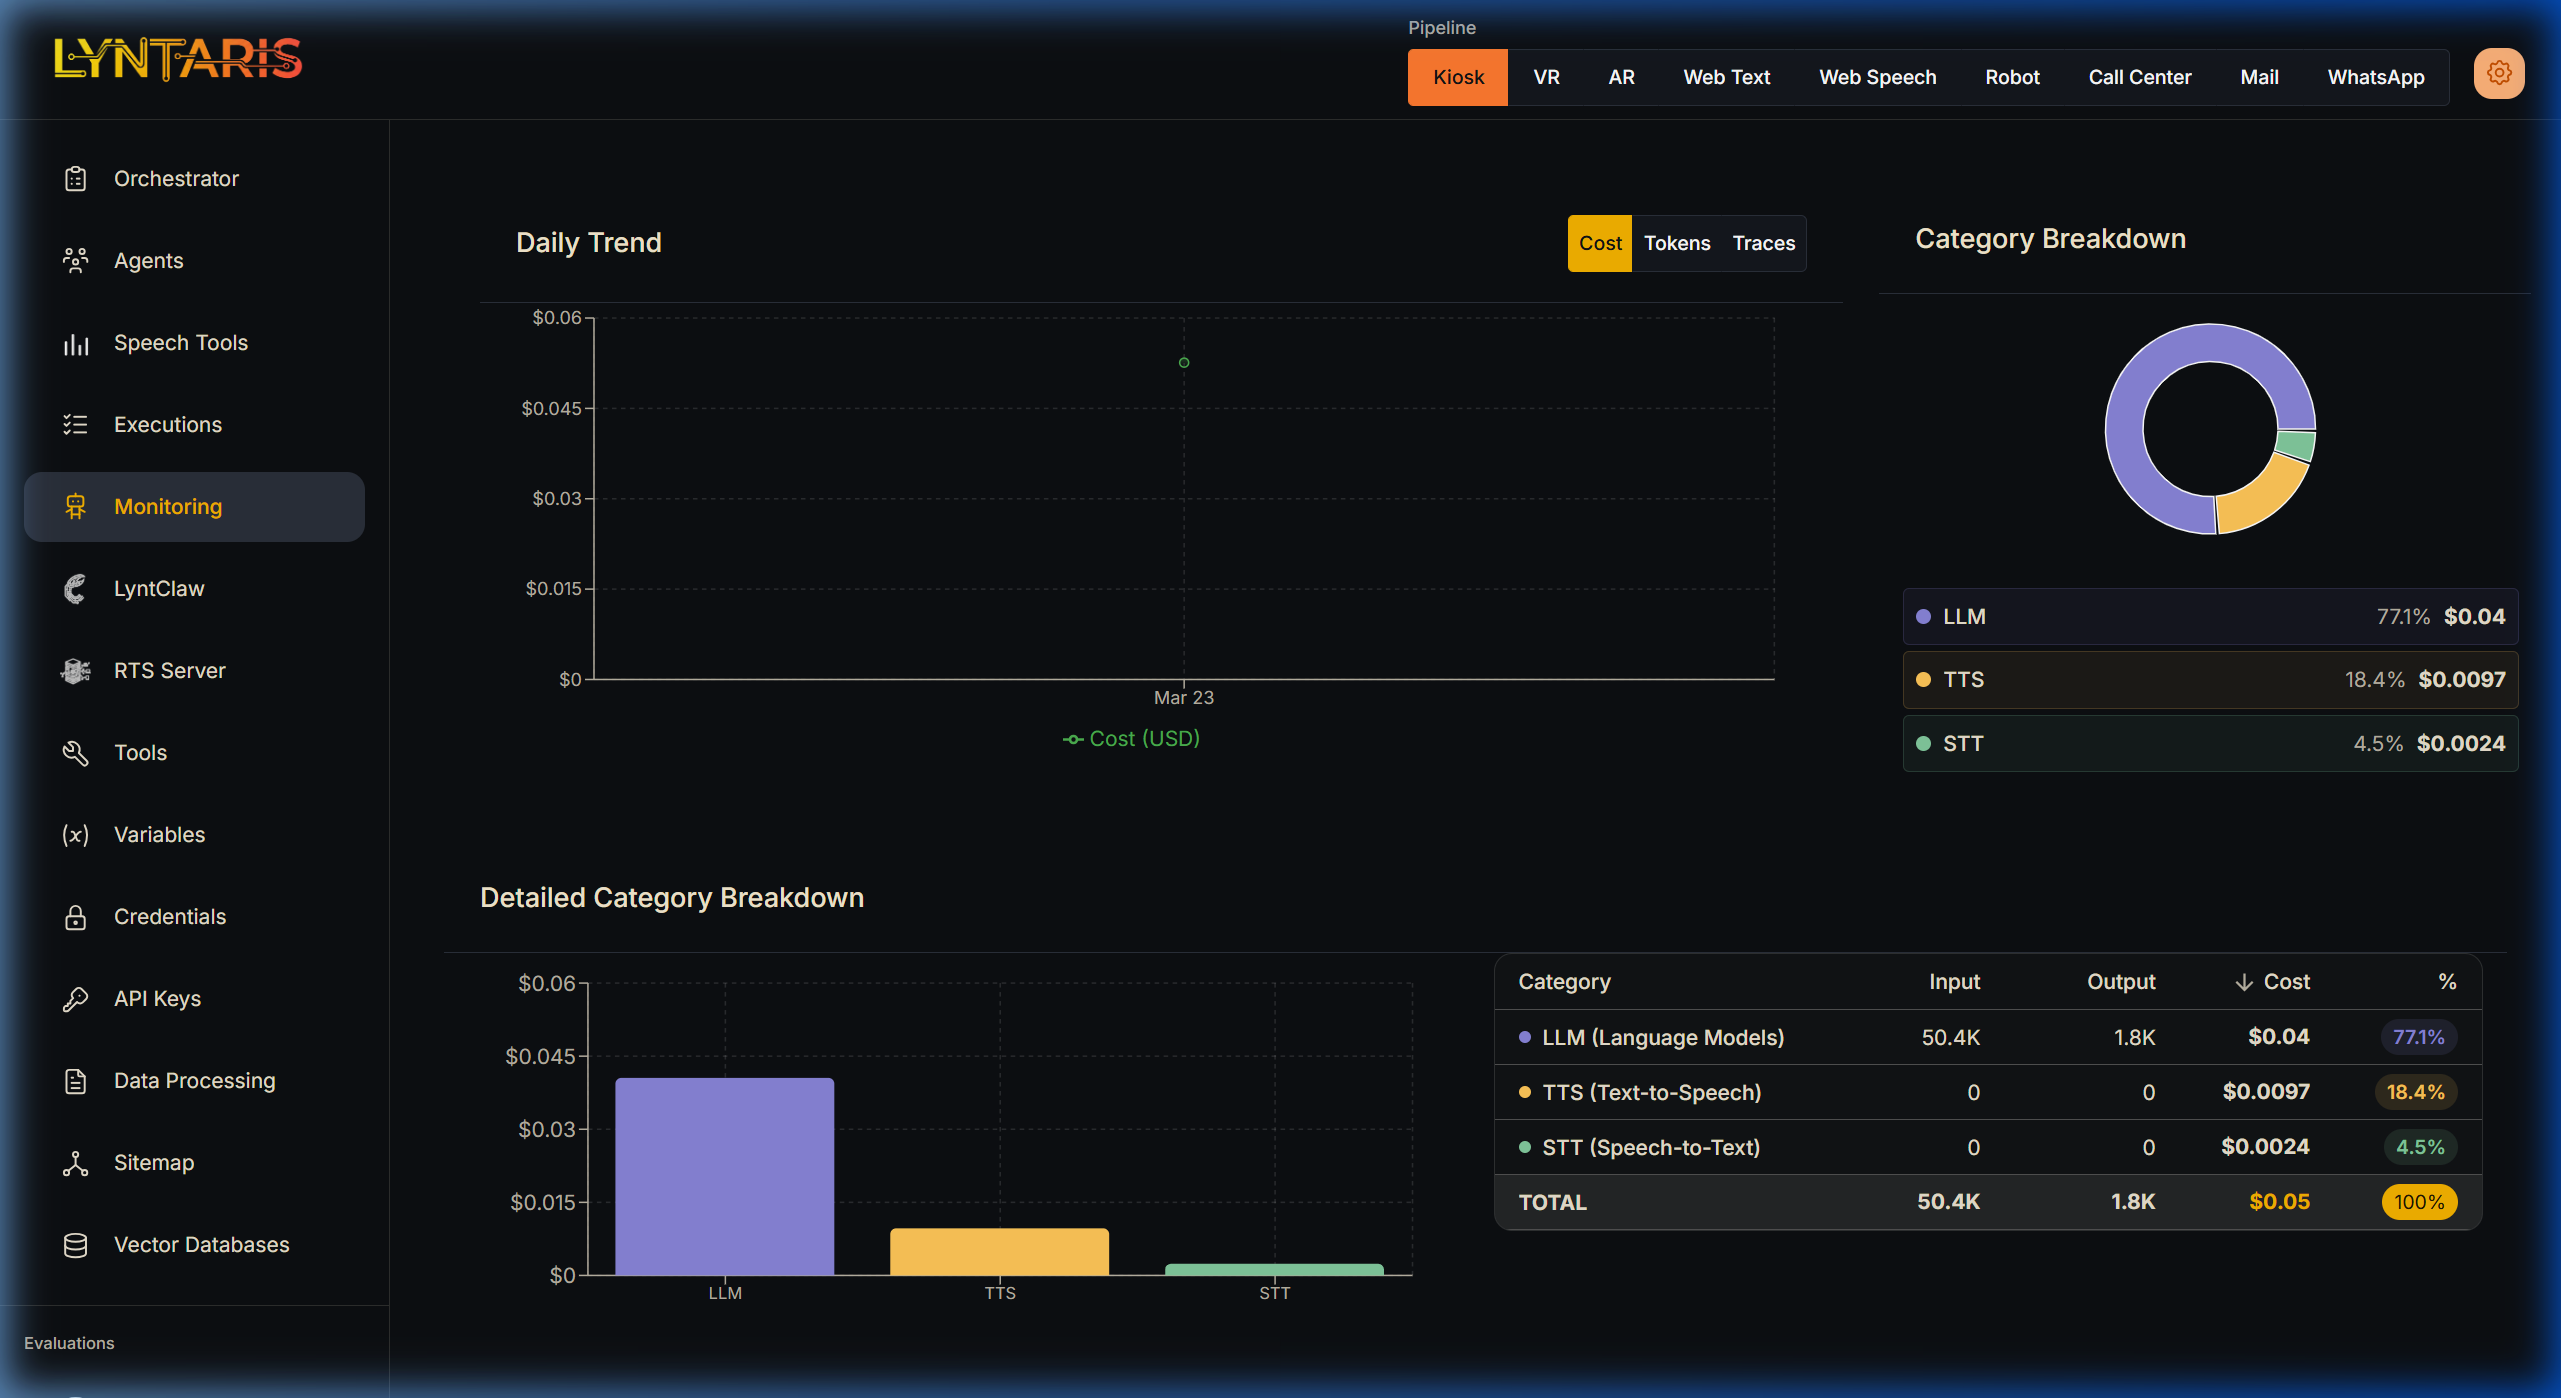
Category Segregation
Lyntaris tracks, tags, and plots your financial expenditure into explicit modalities via its tight integration with the underlying Langfuse metrics engine:
| Modality | Description |
|---|---|
| LLM (Language Models) | The cost incurred directly by neural network text generation (e.g., GPT-4o logical reasoning). |
| TTS (Text-to-Speech) | The audio synthesis costs incurred when generating verbal responses for physical kiosks or VR avatars (e.g., OpenAI tts-1, ElevenLabs). |
| STT (Speech-to-Text) | The transcription costs incurred processing user microphone input before it reaches the orchestrator. |
[!TIP] Why this matters for your ROI: If you notice a sudden spike in costs on the Kiosk pipeline, a quick glance at the Category Breakdown will instantly tell you if users are having unusually long spoken conversations (high LLM/STT cost) or if the TTS layer is generating excessive high-fidelity audio unnecessarily.